Graph Analytics in 2024: Types, Tools, and Top 10 Use Cases

Analytics is generally used on numeric data to gain insights. However, graph analytics analyzes relationships between entities rather than numeric data. By using graph algorithms and relationships in graph databases, graph analytics solutions are uncovering insights in fields like social network analysis, fraud detection, supply chain and search engine optimization.
What is a graph?
To understand graph analytics, we need to understand what a graph means. Graph is a mathematical term and it represents relationships between entities. Two elements make up a graph: nodes or vertices (representing entities) and edges or links (representing relationships). The study of graphs is also known as Graph Theory in mathematics.
There are different types of graphs:
- Directed graphs: All edges are directed from one node to another. It is also called digraph or directed network. Directed graphs represent asymmetric relationships.
- Undirected graphs: All edges are connected from one node to another, but the direction of the relationship is not drawn. It is also called an undirected network. Undirected graphs express symmetric relationships.
- Weighted graphs: A weighted graph has numerical weights on its edges. Those weights are required for shortest path problems and other analysis.
- Cyclic graphs: A cyclic graph has a path from at least one node back to itself. A graph that does not contain a cycle is called acyclic.
What is Graph Analytics?
Graph analytics, also called network analysis, is the analysis of relations among entities such as customers, products, operations, and devices. Organizations leverage graph models to gain insights that can be used in marketing or for example for analyzing social networks.
Many businesses work with graphs. Some examples are:
- Telecom operators’ operate fixed or mobile networks which can be modeled as graphs.
- Telecom customers talk to one another and these relationships form graphs.
Why is it important now?
Graph analytics is important due to the expected market growth. According to a recent graph analytics market report, the graph analytics market size was ~$600 million in 2019, and it is expected to reach ~$2.5 billion by 2024, at a Compound Annual Growth Rate (CAGR) of 34% during the forecast period.
What are the different types of graph analytics?
For each type of graph analytics, there are numerous graph analytics algorithms including both simple heuristics and computationally intensive algorithms aimed at finding perfect solutions. Depending on the value of the solution, different algorithms can be implemented.
Analyzing the current graph
- Centrality analysis: Estimates how important a node is for the connectivity of the network. It helps to estimate the most influential people in a social network or most frequently accessed web pages by using the PageRank algorithm.
- Community detection: Distance and density of relationships can be used to find groups of people interacting frequently with each other in a social network. Community analytics also deals with the detection and behavior patterns of communities.
- Connectivity analysis: Determine how strongly or weakly connected two nodes are.
- Path analysis: Examines the relationships between nodes. Mostly used in shortest distance problems.
Predicting future changes
- Link Prediction: Estimates new relationships or undocumented existence connections by calculating the proximity and structural form of nodes
What are its use cases?
Graph analytics applications exist in journalist, telecom, social networks, finance and operations.
Journalism
A now classic example of using graph analytics to identify networks of relationships is the International Consortium of Investigative Journalists (ICIJ) research on Panama Papers. This research shed light on how authoritarian leaders and politicians used complex sets of shell companies to obscure their wealth from the public.
Armed with graph analytics and document extraction tools, journalists were able to get structured data from thousands of documents on companies in off-shore jurisdictions and use graph analytics to navigate through the structured data in the documents to identify the real owners of these companies.
Compliance
Graph analytics are used to spot frauds or criminals and unlawful actions such as money laundering and payments to sanctioned entities. To detect criminals, analysts use the data of social media, texting, phone calls and emails to create a graph that shows how these data are related to criminals’ records. With that graph, government agencies can identify threats from non-obvious patterns of relationships.
- Financial transactions form graphs and can be analyzed for compliance reasons for example. Banks need to ensure that their customers are not in any way connected to sanctioned entities.
- Loan decisions can be made using social or financial networks.
National security
Though controversial, graph analytics is being used by national intelligence agencies to detect unlawful activity. Communication activity of both suspected and not suspected individuals are collected and analyzed to identify non-obvious relationships and identify potential crimes.
Operations
Compliance
Financial entities are required to prevent payments to sanctioned entities and graph analytics are used to spot such payments.
Fraud detection
In businesses that work with networks such as telecom companies, e-commerce marketplaces or financial institutions, graph analytics is used in fraud detection.
Supply Chain Optimization
Graph analytics algorithms such as shortest path and partitioning are tools to optimize routes in airlines, transportation networks, and supply chain networks.
Utility optimization
Companies that provide utilities such as water, sewage services, electricity, dams, and natural gas can leverage graph analysis to build the most optimal utility distribution network.
Marketing
Social Network Analysis
Social media networks such as Instagram, Spotify and LinkedIn are relationship and connection driven applications. Graph analytics helps identify influencers and communities in social media networks. Social network influencer marketing is an emerging trend due to the increasing number of social media network users and increasing customer skepticism with more established forms of marketing.
Recommendation engines
You must have noticed social networks suggesting “People you may know” or “Songs you may like”. These recommendations rely on collaborative filtering which is a method commonly used by recommendation engines. Collaborative filtering relies on graph analytics to identify similar users and enables personalized recommendations.
Technology companies that are not social networks also rely on collaborative filtering. For example, eBay provides the most relevant search results according to purchase history.
Healthcare
Pandemic Search
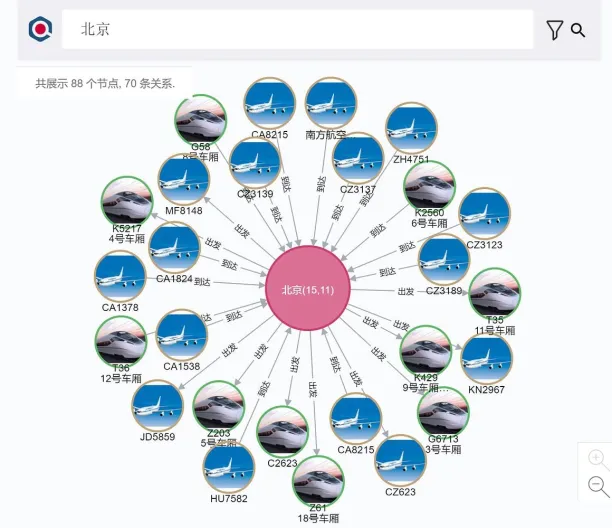
The world is facing a pandemic of COVID-19. Since the virus is known as highly infectious, using a graph database help governments track the spread of the virus. A company called We-Yun has built an application using Neo4j graph database that allows Chinese citizens to check if they came in contact with a known carrier of the virus. The image below is a screenshot of the application that shows all known cases that are connected with the name.
How is it different than regular analytics?
Regular analytics relies on statistics, computer programming and operations research to uncover insights. Graph analytics uses graph specific algorithms to analyze relationships between entities. Clustering, partitioning, PageRank and shortest path algorithms are unique to graph analytics.
Graph databases, which are necessary for advanced graph analytics, are more flexible than relational database management systems (RDBMS). RDBMSs have rigid schemas and it is difficult to add new data relations to them. However, new data relationships can be added in a flexible manner in graph databases.
What are the leading graph database software tools?
Graph database tools are required for advanced graph analytics. Graph databases connect nodes (representing customers, companies, or any other entity.) and create relationships (edges) in the form of graphs that can be queried by users. Some of the leading graph database software tools are:
- Amazon Neptune
- Apache Giraph
- ArangoDB
- Cayley
- DataStax
- FlockDB
- Neo4j
- OrientDB
- Titan
For example, Neo4j is available both open source and through a commercial license for enterprises.
You can also check out our sortable and data-driven lists of analytics platforms. If you want to learn more about analytics, feel free to check our other articles about it:
And if you still have questions, don’t hesitate to contact us:

Cem has been the principal analyst at AIMultiple since 2017. AIMultiple informs hundreds of thousands of businesses (as per similarWeb) including 60% of Fortune 500 every month.
Cem's work has been cited by leading global publications including Business Insider, Forbes, Washington Post, global firms like Deloitte, HPE, NGOs like World Economic Forum and supranational organizations like European Commission. You can see more reputable companies and media that referenced AIMultiple.
Throughout his career, Cem served as a tech consultant, tech buyer and tech entrepreneur. He advised businesses on their enterprise software, automation, cloud, AI / ML and other technology related decisions at McKinsey & Company and Altman Solon for more than a decade. He also published a McKinsey report on digitalization.
He led technology strategy and procurement of a telco while reporting to the CEO. He has also led commercial growth of deep tech company Hypatos that reached a 7 digit annual recurring revenue and a 9 digit valuation from 0 within 2 years. Cem's work in Hypatos was covered by leading technology publications like TechCrunch and Business Insider.
Cem regularly speaks at international technology conferences. He graduated from Bogazici University as a computer engineer and holds an MBA from Columbia Business School.
To stay up-to-date on B2B tech & accelerate your enterprise:
Follow onNext to Read
How Do Businesses Democratize Analytics With AI in 2024?
What is Analytics? How is it Evolving in 2024?
IoT Analytics: Benefits, Challenges, Use Cases & Vendors [2024]

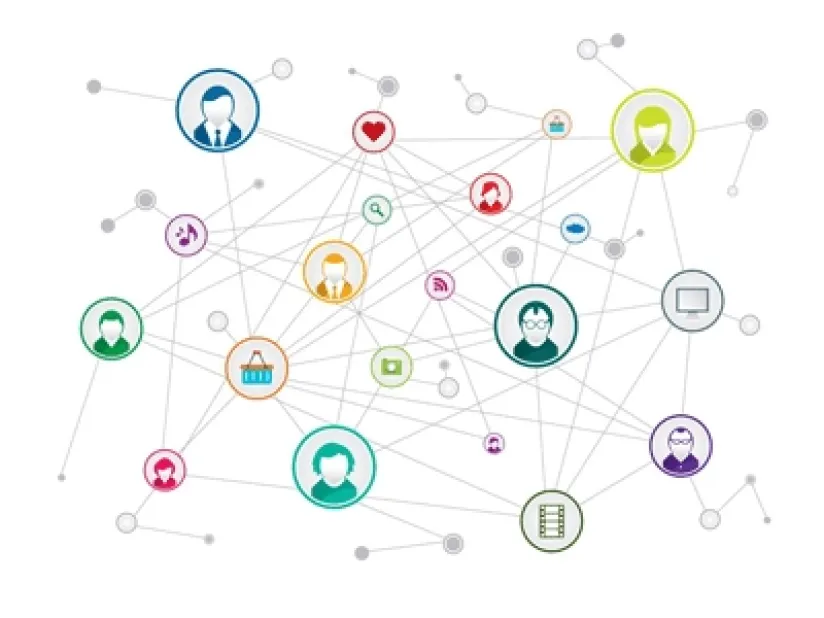
Thanks for this overview. Do you know of any libraries that can be used to create graph-like visualizations without a graph database? Can a graph database be used to produce the 2d headliner image for this article?

To prepare a 2d graphic, a graph database would be a bit too much effort. If you need something like the 2D headliner image of this article, you can use a Javascript charting library like Plotly which can do X Y scatter with lines.
Related research
Comments
Your email address will not be published. All fields are required.