Comprehensive Guide to Survey Analytics in 2024
Data collection is a key aspect of developing artificial intelligence related products. In this article, we provide a simple guideline for deciding on what data collection method to use and how to decide on that method. Then, we showcase some methods to collect data, such as text analytics, mobile analytics and image analytics. Those methods are becoming more popular and becoming real-life applied methods rather than theoretical frameworks.
Surveying studies the sampling of individual units from a population. It aims to make statistical inferences about the population.
Hence, data and the way to collect data is of vital importance. There are numerous ways to collect the data for the studies. One can construct and conduct surveys in person. With the advances in big data and artificial intelligence, it is easier to reach more data with a higher accuracy.
The usual stages for surveying are;
- defining the problem and deciding on survey method to use
- identifying and selecting the sample members
- contacting the sampled individuals
- evaluating and testing the questions
- checking the data for consistency and accuracy
- preparing and presenting the analysis
Selecting the Survey Method
Once the problem is defined and the method is decided, the rest of the process rests on data collection. That is why, we hear the words analytics, artificial intelligence, chatbots much more frequently. Defining the problem or the objective of the study depends on the specifics of the projects, but factors affecting the decision of which survey method to use as follows;
- costs
- coverage of the target population
- the flexibility of asking questions
- response accuracy
From Traditional to Digital
Traditional approaches started with paper-and-pencil interviewing (PAPI) with the advancement of technology, surveying shifted to computer-assisted interviewing (CAI). Those methods are important in the sense that, these are the ones that are still used in small-scale studies. We still see some form of traditional data collection methods in daily life such as face-to-face surveys (CAPI), telephone surveys (CATI), and mail surveys (CASI, CSAQ), but they are being replaced by the web-based studies.
Increasing access to computers, internet, and mobile platforms increased the returns for web-based study by forming the right sample of the population. Market research methods are becoming predominantly web-based. Today, greater market share can be acquired by studying the data coming from the web. They are faster, cheaper and simpler. The interaction between the individuals is lower hence no social pressure on the respondent. Intricate skip mechanism can be implemented, and the logical check mechanism can ensure the consistency. Survey software ensures this consistency through imputing the data with contradictory responses.
On the other hand, web-based studies suffer from low response rate and the difficulty for forming a cost-effective incentive mechanism to reach the same response rate as the traditional studies. Also, lack of familiarity with the survey platform can worsen the quality of data collected.
Experimental Design
Surveys need to construct a control group for assessing the impact of the change. A minor modification can affect the key metrics such as conversion and bounce rate. So right statistical design is of vital importance for statistical analysis. Focusing on A/B testing is one of the key factors for success. This creates a value by reducing the risk of a low return modification. Traditionally it is tested through focus groups or questionnaires. Now, any kind of testing, that can be ad-testing, product feature testing can be conducted digitally. This would provide better and faster customer insights.
Conjoint analysis is a market research method for measuring how people value different futures of the product. Now it can be conducted much more easily since targeting the right people became easier. It would provide greater accuracy for deciding on the value of the future, design or benefit of the product.
Turf analysis helps market researchers to decide on the right combination of products and services. Different combinations can be analyzed more dynamically since it is now possible to present different combinations of products depending on the feedback and the trends. Findings can be used for greater market access and market penetration.
With the availability of vast amounts of data, those tests can be targeted to much more specific sub-groups. Rather than focusing on socio-economic groups, now the limit of the specification is expanded. This is important in the sense that, a company aiming for a greater penetration can access and do the study for a specific group.
For cases where the exact control group can’t be formed, advancements in statistical methodology aid the companies. Concepts like bootstrapping and propensity score matching can now help the firms for estimating the desired parameter.
One such firm is Optimizely which enables businesses to deliver continuous experimentation and personalization across websites, mobile applications, and connected devices. Optimizely enables businesses to experiment deeply with their technology stack and broadly across the entire customer experience. Making it possible to reach higher scores in customer satisfaction surveys.
Once decided on the way to do the study and the sample to work with, the focus should be on different channels to collect data. Some major trends are as follows;
Mobile Surveys
Increasing availability of cell phones made it easier to collect data. New apps are changing the way to conduct the surveys. One major example is dial testing. The traditional method is replaced by new apps, making it possible to conduct the same survey without any specific spatial restriction. Making people provide real-time review whether they are in the office or home, local or distant.
Increasing connectivity is one factor that helped the survey analytics to advance. Mobile connection is becoming more prevalent and cheaper as the technology advances. Connection speeds are increasing. This increases the amount of data available for surveying. 2G was able to support 171Kilobits per second and now today, 4G connections can support up to 100 Megabit per second. Hence, we experienced a huge increase in data available for mobile research.
People now provide higher quality and higher speed data due to increased connectivity. One other aspect of the connectivity is the Internet of Things (IoT). As the concept evolves, connected products in our lives are becoming valuable survey sources. The data generated can be used in product improvement and quality assurance. This way, customer satisfaction can be maximized.
One such platform is GoSpotCheck which has created a simple, uniform way to collect, structure and share retail intelligence. Through the mobile app, teams can streamline field data collection and make better decisions. They allow their customers to customize a mission through GoSpotCheck’s web app and release it to customer’s field team. Team members collect information via the GoSpotCheck mobile app and report it back in real time.
(Courtesy of Ubisend)
Text Analytics for Surveys
One other way to collect this data is through text analysis. Majority of studies suffers from forcing the individual to choose from a list of options. Focusing on text analysis can reverse that understanding. Text analysis allows the person surveyed to express her opinion freely without any restriction or any in any predefined survey structure.
With the advances, the text can be collected and classified. The source of the information can be a social media post, a shopping review, an artificial intelligence chatbot or e-mails. This method can be used for classifying the axis of severity, positivity or negativity of the comments. Making it possible to reach insight beyond the traditional surveying options can provide. Net promoter scores can be calculated more accurately since customer reviews are not limited to the survey questions.
Gavagi a Swedish, award-winning, language technology company focuses on this issue. The team at Swedish Institute of Computer Science, which later became Gavagai, participated in the Real-World Intelligence research program in the 1990’s. They are pioneers in language AI and have developed their own Word Space Technology for more than 20 years. Their research team has published more than 400 academic papers. Extreme scalability, learning, automation and language agnosticism are some features of their technology, which is based on a neurologically plausible method that models meaning on-the-fly.
Luminoso is another company that uses artificial intelligence, natural language processing, and machine learning to derive insights from unstructured data such as contact center interactions, chatbot and live chat transcripts, product reviews, open-ended survey responses, and email. Luminoso’s software identifies and quantifies patterns and relationships in text-based data, including domain-specific or creative language.
Check our data-driven list of sentiment analysis services to determine which option satisfies your company’s needs.
Image Analytics for Surveys
Advancements in machine learning allowed indirect surveying of population. A company can collect the images shared publicly and try to construct a survey through that approach. Uploaded images can be classified into accurate subcategories to reflect the views of the population. Depending on the color adjustment of the image or the angle it was photographed can contribute the improvement of the product or place. But this requires a higher processing capability for the firm.
Companies specializing in that kind of study makes it possible to analyze the images and make an inference and provide insights regarding the condition. One such platform is h2o.ai which is an open source, in-memory, distributed, fast, and scalable machine learning and predictive analytics platform that allows you to build machine learning models on big data and provides easy productionalization of those models in an enterprise environment.
(Courtesy of VPI)
Phone Surveys
Survey through phone-calls are also making the transition to the digital age. Speech analytics is another way to implement the advances in technology. Now, there are numerous methods to survey through analyzing the speech.
It is possible to analyze the emotions of the respondent through analyzing tone and pitch. Making it possible to see the elicited response. Another way is to find the hot-topics automatically. It is possible to find the most frequently used words and the issues. This can provide valuable insight by showing the issues requiring immediate action.
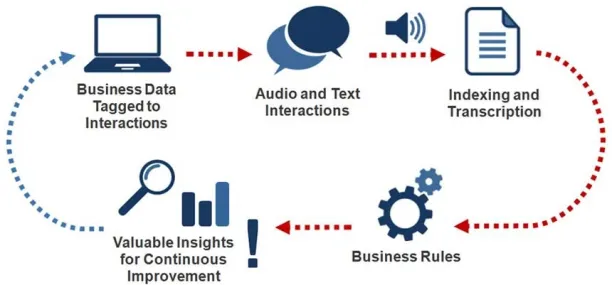
VoiceBase a leading on-demand speech analytics platform makes this possible by providing easy-to-use APIs that automatically transcribe audio and video content by extracting relevant keywords and topics, enabling the instant search and discovery of spoken information.
Keatext is a cost-effective, cloud-based app that quickly gives businesses a picture of their entire interaction with their customers, across all touch points so they can take the right action. Keatext uses natural language processing technology to analyze unstructured customer feedback such as customer comments, product reviews, call center transcripts and open-ended survey responses.
Survey Findings
One major area to focus on is deciding how to present the survey findings. Graphs and charts are the conventional tools for conveying the message. The dynamic data collection and surveying environment require a user interface with the same capabilities. This led to the development of highly dynamic dashboards.
Rather than using a static, snapshot of the surveying, new platforms allow to integrate the data source and extract the information and present it in a compact form, without wasting any time on transferring the data and creating the desired charts and graphs in a separate environment. Making it possible to present key findings easier.
This native integration allows the study to maintain its recency. This method is important for an enterprise to present its key statistics and metrics. It would provide the public with the right information, no matter what year or the day the chart or the graph is created.
MarketSight focuses on this issue and provides powerful and intuitive software solutions. They provide easy-to-use tools that enable researchers and analysts to focus on finding and presenting critical new insights about their business such as automatically applying the correct statistical tests and automatically generating new variables, reports, and analyses to help you focus on finding the story within the data.
As aimultiple.com, we provide AI vendor profiles include a detailed description of their services and 500+ customer references in 100+ use cases. To learn more about autonomous checkout systems or other use cases, visit our website.
You can also check our data-driven lists of analytics platforms and survey tools to find the best option for your business needs.
If interested, here is also our data-driven list of survey participant recruitment services.
Are you looking for an AI vendor? Let us know:

Cem has been the principal analyst at AIMultiple since 2017. AIMultiple informs hundreds of thousands of businesses (as per similarWeb) including 60% of Fortune 500 every month.
Cem's work has been cited by leading global publications including Business Insider, Forbes, Washington Post, global firms like Deloitte, HPE, NGOs like World Economic Forum and supranational organizations like European Commission. You can see more reputable companies and media that referenced AIMultiple.
Throughout his career, Cem served as a tech consultant, tech buyer and tech entrepreneur. He advised businesses on their enterprise software, automation, cloud, AI / ML and other technology related decisions at McKinsey & Company and Altman Solon for more than a decade. He also published a McKinsey report on digitalization.
He led technology strategy and procurement of a telco while reporting to the CEO. He has also led commercial growth of deep tech company Hypatos that reached a 7 digit annual recurring revenue and a 9 digit valuation from 0 within 2 years. Cem's work in Hypatos was covered by leading technology publications like TechCrunch and Business Insider.
Cem regularly speaks at international technology conferences. He graduated from Bogazici University as a computer engineer and holds an MBA from Columbia Business School.
To stay up-to-date on B2B tech & accelerate your enterprise:
Follow onNext to Read
5 Essential Steps of Online Survey Analytics in 2024
In-Depth Guide to Top 15 Open Source Web Crawlers in 2024
Ultimate Guide to Analytics Consulting in 2024
Related research
7 Best Online Survey Tools in 2024 Based on 30k+ Reviews
Comments
Your email address will not be published. All fields are required.