Top 5 Enterprise Observability Tools in '24 based on 2.5+K Reviews
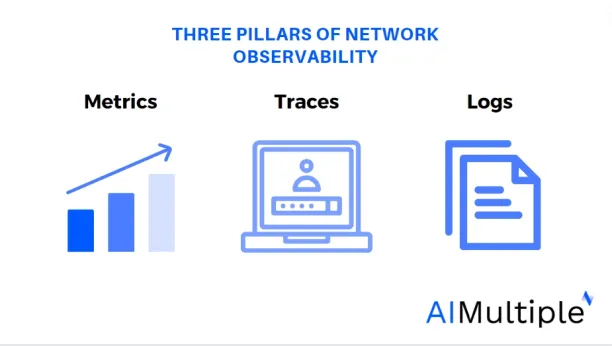
Enterprise observability refers to the ability of an IT team to understand and predict the internal states of their systems based on the external outputs. It encompasses the collection, processing, and analysis of data from various parts of an organization’s IT infrastructure. This approach enables businesses to detect and resolve issues before they impact the user experience, and to optimize operations for better performance and efficiency. The “three pillars” of observability supported by events that offer context and insights into anomalies and system behavior.
In this article, we’ll explore the features, advantages, and drawbacks of enterprise observability tools.
| Vendors | Reviews* | Free Trial | Employees** | Price |
|---|---|---|---|---|
| ManageEngine Applications Manager | 4.7/5 based on 92 reviews | ✅ for 30-days | 201-500 | Starting $795 /month with Annual subscription fee for 50 Devices
Pack with 2 Users
|
| Dynatrace | 4.5/5 based on 1,242 reviews | ✅ for 15-days | 1,000-5,000 | Full-Stack Monitoring: $0.08 per hour for an 8 GB host. Infrastructure Monitoring: $0.04 per hour Kubernetes |
| Datadog | 4.3/5 based on 464 reviews | ✅ for 14-days | 1,000-5,000 | Starting $15 /month per host |
| Splunk | 4.3/5 based on 407 reviews | ✅ for 14-days | 1,000-5,000 | Not shared publicly |
| New Relic | 4.3/5 based on 428 reviews | N/A | 51-200 | Not shared publicly |
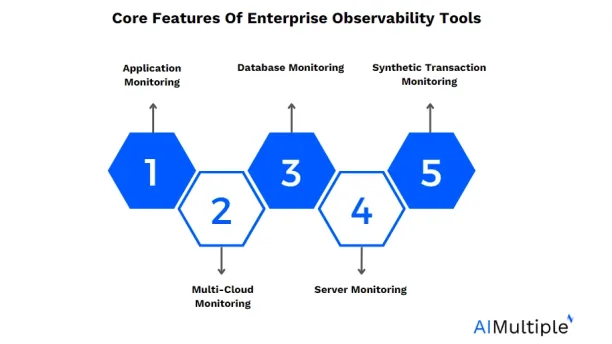
Core Features Of Enterprise Observability Tools
Leading Enterprise Observability Tools Analyzed
1. ManageEngine Applications Manager
ManageEngine Applications Manager is an application performance monitoring solution that offers monitoring of various IT components such as servers, databases, applications, and more.
- Automated Discovery & Dependency Mapping: Auto-discovers applications and services and maps data into a real-time dependency map, automating remediation through integration with CMDBs.
- ERP Monitoring: Offers network monitoring for popular ERP solutions like SAP, Oracle EBS, Microsoft Dynamics CRM & AX, and Siebel CRM.

Source: Capterra1
Pros
- Users appreciate the ease of deployment and configuration of ManageEngine Application Manager.2
- The tool allows users to create personalized dashboards tailored to their specific monitoring needs, offering a quick and efficient overview of critical metrics.3
Cons
- Users face notorious problems with updating the Applications Manager plugin in OpManager, SNMP device monitoring issues, and find the graphical interface not user-friendly. 4
- Users report occasional delays in support response times. 5
2. Dynatrace
Dynatrace is an enterprise observability platform that offers automatic network monitoring of cloud-native environments, microservices, and hybrid cloud infrastructures.
- AI-Driven Insights: Provides AI insights to focus on outcomes instead of false positives, boosting team productivity and reducing outages and mean time to recovery (MTTR).
- Interactive Tour: Offers a tour to help users tame Kubernetes, understand platform health, and automate observability and anomaly detection.
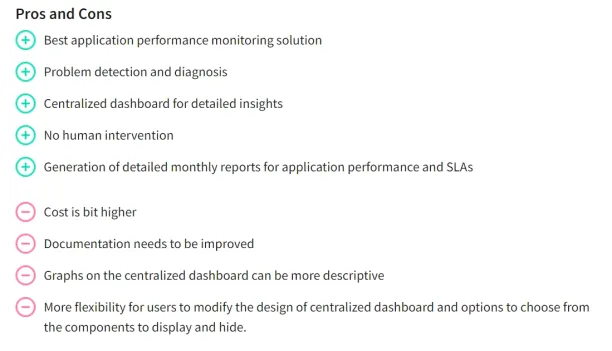
Source: TrustRadius User Review of Dynatrace6
Pros
- Users appreciate Dynatrace’s end-to-end visibility of application stacks for effective issue troubleshooting.7
- Users appreciate Dynatrace’s automatic discovery and monitoring of new services and components in dynamic environments, reducing manual configuration efforts.8
Cons
- Users find integration with applications and ActiveGateways challenging, preferring more seamless methods like API Keys.9
- The tool becomes cumbersome and overwhelming with hundreds or thousands of queues per queue manager, making it difficult to view specific queue manager names easily.10
3. Datadog
Datadog is a cloud-based monitoring and analytics platform that provides observability across cloud, containers, applications, and infrastructure.
- Maximize Savings with Log Processing: Filters logs before routing, compresses log sizes, and ensures critical fields are retained to control expenses.
- Avoid Vendor Lock-In: Focuses business continuity throughout the migration process by dual-shipping logs to multiple vendors and ensuring onboarding of new log data sources and destinations.
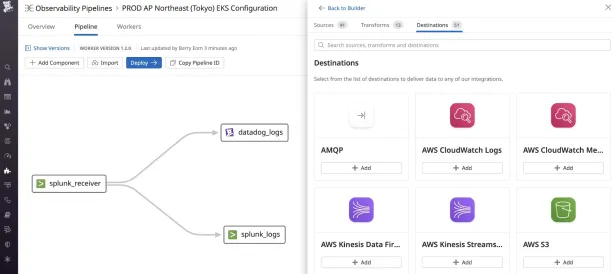
Source: Datadog Observability Pipelines11
Pros
- The tool offers a broad suite of observability products, allowing easy integration with different providers and providing a user-friendly interface for essential metrics overview.12
- Users praise Datadog for its simplicity and excellent value for money, offering a central resource for administering and monitoring servers and applications.13
Cons
- The complexity of Datadog’s features may be overwhelming for smaller teams or organizations lacking dedicated DevOps or security personnel, potentially steepening the learning curve.14
- Some users find that Datadog’s documentation for integration setup can be outdated and challenging for newcomers, requiring multiple contacts with the support team for assistance, although the support team is responsive.15
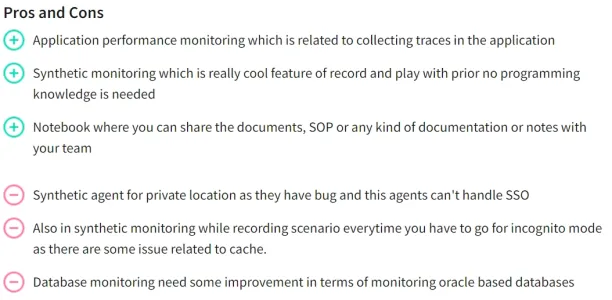
Source: TrustRadius User Review of Datadog16
4.Splunk
Splunk is a data analytics and visualization platform that offers a range of capabilities for monitoring, analyzing, and acting on machine-generated data.
- Interface for Observability Cloud: Provides a single interface for Splunk APM, Splunk RUM, Splunk Infrastructure Monitoring, and Splunk Log Observer Connect, enabling users to explore benefits and insights.
- Ease of Onboarding: Offers Observability Jumpstart, which allows users to experience Splunk Observability Cloud using sample data in a pre-instrumented environment, getting started in less than 15 minutes.
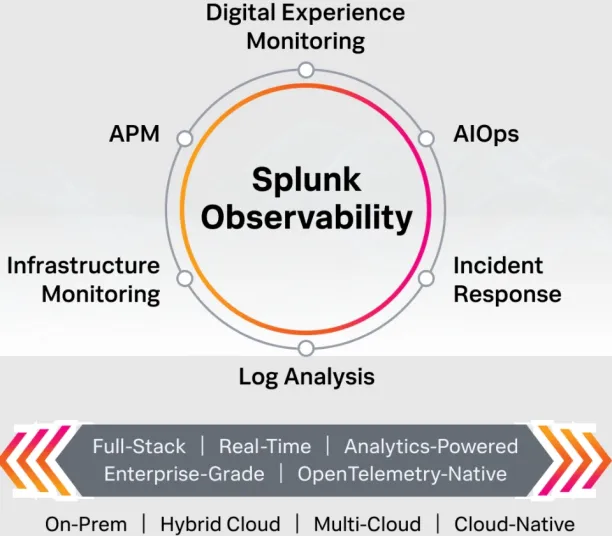
Source: Splunk 17
Pros
- Users find Splunk easy to implement with a user-friendly query language, enabling non-technical persons to create dashboards and sufficient documentation support.18
- The tool offers integration options, advanced analytics, and is highly scalable, making it ideal for large enterprises.19
Cons
- The platform can be complex to set up and manage. Additionally, it is often considered more expensive than some of its competitors, which might be a drawback for smaller organizations.20
- Users find Splunk’s design complex and note long execution times. They suggest incorporating AI for better understanding of system logs and auto-learning-based alerting.21
5.New Relic
New Relic is another enterprise observability platform that provides network monitoring and analytics solutions for modern software architectures.
- Connected Experience: Correlates issues across the stack, allowing users to debug and collaborate from their IDE with AI assistance.
- Instant Observability Quickstarts: Bundles everything needed to start monitoring like a pro right out of the box, integrating easily with hundreds of tools and open standards.
Pros
- Users find setting up New Relic for their applications effortless, with seamless integration with Heroku, providing valuable insights without hassle.22
- The tool’s synthetic checks and alerts are effective and teams can get there information to troubleshoot their applications.23
Cons
- The software presents a challenge in making sense of the mountain of data, requiring users to invest time and effort to decipher its meaning and utility for the organization.24
- New Relic’s UI could benefit from a facelift for a more intuitive and enjoyable user experience, enhancing productivity.25
How does enterprise observability differ from network monitoring?
Enterprise observability tools provide an understanding of an organization’s entire IT environment, encompassing applications, infrastructure, services, and user experience. It focuses on predicting and understanding internal system states based on external outputs, facilitating proactive issue detection and resolution. In contrast, network monitoring specifically targets the performance and health of the network infrastructure, analyzing aspects like devices, connections, bandwidth usage, and network traffic. While enterprise observability relies on data from diverse sources such as logs, metrics, traces, and user interactions, network monitoring primarily utilizes network-centric data for ensuring network availability, reliability, and security.
What are the challenges in implementing observability?
Tool Selection: Choosing the right enterprise observability tools that meet the organization’s needs and budget can be daunting due to the multitude of options available in the market.
Data Integration: Integrating data from diverse sources such as logs, metrics, traces, and user interactions into a unified platform for analysis requires careful planning and may encounter compatibility issues.
Skill Gap: Organizations may lack the expertise and skills required to effectively utilize observability tools, including data analysis, monitoring, and troubleshooting techniques.
Cost: Implementing observability tools and infrastructure can incur significant costs, including licensing fees, training expenses, and ongoing maintenance costs.
Security and Compliance: Ensuring the security and compliance of sensitive data collected and analyzed by observability tools is paramount and may require additional measures and safeguards.
How to select an enterprise observability tool?
When choosing an enterprise observability solution, consider the following criteria:
Data Collection: The solution should be capable of integrating and correlating data across all four key components—metrics, logs, traces, and events.
Analytics and Visualization Tools: Effective data analysis and intuitive visualization capabilities are essential for quick issue identification and resolution.
Integration with Existing Tools: The observability platform should seamlessly integrate with your existing IT management tools and workflows.
Vendor Support and Community: Consider the vendor’s reputation, the support offered, and the robustness of the user community.
For more on network monitoring
- Top 5 Network Monitoring Tools in Windows in 2024
- Top 4 AI Network Monitoring Use Cases and Real-Life Examples in ’24
- Top 7 Free Network Monitoring Tools based on 1,000+ Reviews in 2024
- Top 10 Network Monitoring Best Practices in 2024
External Links
- 1. ” ManageEngine Applications Manager Reviews”. Retrieved May 06, 2024
- 2. “A Review of ManageEngine Applications Manager by Himanshu R.”. Capterra October 18, 2023. Retrieved May 06, 2024
- 3. “A Review of ManageEngine Applications Manager by Chun L.”. Capterra April 25, 2024. Retrieved May 06, 2024
- 4. “A Review of ManageEngine Applications Manager by Łukasz P.”. Capterra November 07, 2023. Retrieved May 06, 2024
- 5. “A Review of ManageEngine Applications Manager by Himanshu R.”. Capterra October 18, 2023. Retrieved May 06, 2024
- 6. “Dynatrace”. Retrieved May 05, 2024
- 7. “A Review of Dynatrace”. G2 Feb 01, 2024. Retrieved May 06, 2024
- 8. “A Review of Dynatrace”. G2 Jan 12, 2021. Retrieved May 06, 2024
- 9. “A Review of Dynatrace”. G2 Feb 01, 2024. Retrieved May 06, 2024
- 10. “A Review of Dynatraceby Susan B.”. G2 Jan 27, 2022. Retrieved May 06, 2024
- 11. “Datadog Observability Pipelines”. Retrieved May 05, 2024
- 12. “A Review of Datadog”. G2 April 03, 2024. Retrieved May 06, 2024
- 13. “A Review of Datadog by Jon L.”. G2 Sep 14, 2023. Retrieved May 06, 2024
- 14. “A Review of Datadog”. G2 April 03, 2024. Retrieved May 06, 2024
- 15. “A Review of Datadog by Jon L.”. G2 Sep 14, 2023. Retrieved May 06, 2024
- 16. “Datadog”. Retrieved May 05, 2024
- 17. “Splunk Observability.” Retrieved May 06, 2024
- 18. “A Review of Splunk”. Capterra Feb 12, 2024. Retrieved May 06, 2024
- 19. “A Review of Splunk by Davis M.”. Capterra September 19, 2022. Retrieved May 06, 2024
- 20. “A Review of Splunk by Rob B.”. Capterra March 12, 2021. Retrieved May 06, 2024
- 21. “A Review of Splunk by Parth P.”. Capterra Dec 04, 2021. Retrieved May 06, 2024
- 22. “A Review of New Relic by Arjun K.”. Capterra May 26, 2023. Retrieved May 06, 2024
- 23. “A Review of New Relic”. Capterra Jan 19, 2024. Retrieved May 06, 2024
- 24. “A Review of New Relic by Jonathan S.”. Capterra Aug 19, 2021. Retrieved May 06, 2024
- 25. “A Review of New Relic by Arjun K.”. Capterra May 26, 2023. Retrieved May 06, 2024

Cem is the principal analyst at AIMultiple since 2017. AIMultiple informs hundreds of thousands of businesses (as per Similarweb) including 60% of Fortune 500 every month.
Cem's work has been cited by leading global publications including Business Insider, Forbes, Washington Post, global firms like Deloitte, HPE, NGOs like World Economic Forum and supranational organizations like European Commission. You can see more reputable companies and media that referenced AIMultiple.
Throughout his career, Cem served as a tech consultant, tech buyer and tech entrepreneur. He advised enterprises on their technology decisions at McKinsey & Company and Altman Solon for more than a decade. He also published a McKinsey report on digitalization.
He led technology strategy and procurement of a telco while reporting to the CEO. He has also led commercial growth of deep tech company Hypatos that reached a 7 digit annual recurring revenue and a 9 digit valuation from 0 within 2 years. Cem's work in Hypatos was covered by leading technology publications like TechCrunch and Business Insider.
Cem regularly speaks at international technology conferences. He graduated from Bogazici University as a computer engineer and holds an MBA from Columbia Business School.
Sources:
AIMultiple.com Traffic Analytics, Ranking & Audience, Similarweb.
Why Microsoft, IBM, and Google Are Ramping up Efforts on AI Ethics, Business Insider.
Microsoft invests $1 billion in OpenAI to pursue artificial intelligence that’s smarter than we are, Washington Post.
Data management barriers to AI success, Deloitte.
Empowering AI Leadership: AI C-Suite Toolkit, World Economic Forum.
Science, Research and Innovation Performance of the EU, European Commission.
Public-sector digitization: The trillion-dollar challenge, McKinsey & Company.
Hypatos gets $11.8M for a deep learning approach to document processing, TechCrunch.
We got an exclusive look at the pitch deck AI startup Hypatos used to raise $11 million, Business Insider.
To stay up-to-date on B2B tech & accelerate your enterprise:
Follow on


Comments
Your email address will not be published. All fields are required.