Top 8 Network Observability Tools in '24: 2k+ Reviews Analyzed

Cem is the principal analyst at AIMultiple since 2017. AIMultiple informs hundreds of thousands of businesses (as per Similarweb) including 60% of Fortune 500 every month.
Cem's work has been cited by leading global publications including Business Insider, Forbes, Washington Post, global firms like Deloitte, HPE, NGOs like World Economic Forum and supranational organizations like European Commission. You can see more reputable companies and media that referenced AIMultiple.
Network observability offers insights into a network’s performance metrics, allowing organizations to identify and address vulnerabilities. This approach supports network monitoring and analysis for timely issue resolution. Leveraging AI, it facilitates automatic detection of anomalies in network traffic and network performance. Network observability tools enable problem-solving throughout the infrastructure and application layers.
Top 8 network observability tools
| Vendors | Reviews | Free Trial | Employees** | Price |
|---|---|---|---|---|
| AKIPS | 5/5 based on 4 reviews | ✅ for 30-days | 14 | Not shared publicly |
| Obkio | 4.9/5 based on 51 reviews | ✅ for 14-days | 24 | Starting $399 /month -10 agents |
| ManageEngine Site24x7 | 4.7/5 based on 233 reviews | ✅ for 30-days | 302 | Standard Edition: $245 [25 devices] Professional Edition: $345 [25 devices]
and more options
|
| Dynatrace | 4.5/5 based on 1,242 reviews | ✅ for 15-days | 4,200 | Full-Stack Monitoring: $0.08 per hour for an 8 GB host. Infrastructure Monitoring: $0.04 per hour Kubernetes Monitoring: $0.002 per hour and more options. |
| Cisco ThousandEyes | 4.5/5 based on 77 reviews | ✅ for 15-days | 761 | Not shared publicly |
| LogicMonitor | 4.5/5 based on 502 reviews | ✅ for 15-days | 1,070 | Logs correlation: $4.00 USD/GB/month for 30 day retention $7.00 USD/GB/month for yearly retention and more options |
| Datadog | 4.3/5 based on 464 reviews | ✅ for 14-days | 5,200 | Starting $15 /month per host |
| Zabbix | 4.3/5 based on 185 reviews | N/A | 126 | open source |
* Reviews are based on Capterra and G2. Transparency statement: Vendors are ranked according to their average ratings, except sponsors which receive links.
** The number of workforce is gathered from the companies’ LinkedIn pages.
Common Features of Network Observability Tools
Below are the key shared features of network observability tools that make these tools indispensable for organizations:
- Real-time network monitoring: All mentioned tools offer the capability to monitor network performance in real time.
- Cloud, hybrid, and on-premises support: These network observability tools are designed to integrate with various environments, including cloud-based, hybrid, and on-premises setups.
- Analytics and visualization: With the deployment of analytics and visualization tools, these platforms provide insights into network performance.
- Web app monitoring (HTTP, FTP, Browser): The network observability tools offer insights into web application performance.
- Scalability for large networks: Platforms such as AKIPS emphasize scalability, ensuring that they can handle the demands of monitoring.
- Reporting and alerting capabilities: Consistent across these tools are robust reporting and alerting features.
Leading Network Observability Tools in 2024
1. AKIPS Network Monitoring
AKIPS Network Monitoring specializes in network observability for complex environments, offering monitoring capabilities that ensure network visibility. Explore AKIPS with a free trial.
Key Aspects:
- Network Discovery: Utilizes a method by pinging every IP address, avoiding network overload and eliminating the need for manual CSV file inputs for network discovery.
- Device Fingerprinting: Employs SNMP v3 engine ID and interface MAC addresses for precise device identification, automatically removing duplicate device entries.
- Vendor-Specific MIB Detection: Identifies and configures vendor-specific Management Information Base (MIB) objects, enhancing device compatibility.
Pros:
Filtering options: It offers the ability to filter devices by sysName, vendor, model, or location, facilitating targeted network management.
Alerting and event handling: The tool features alert and event management capabilities, with the ability to filter out noise and prioritize critical events through regex and grouping rules.
Cons:
- Learning curve for advanced features: The features of AKIPS might present a learning curve, especially for users new to network management systems, requiring time to fully leverage its capabilities.
- Potential Over-reliance on Ping Methodology: The ping-based discovery method may not capture all nuanced network scenarios or devices with ping responses disabled.

Figure 1: A Customer review on AKIPS
Source: Capterra1
2. Obkio
Obkio simplifies network observability, focusing on monitoring and the end-user experience to detect and resolve network issues before they impact business operations.
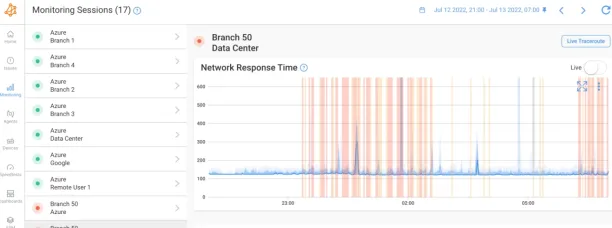
Figure 2 : Obkio Monitoring Sesions
Source: Obkio Website2
Key Aspects:
- Monitoring agent deployment: Obkio’s Monitoring Agent can be installed on various systems like Windows, Linux, VMWare, and Hyper-V, offering flexibility in monitoring different environments.
- Plug-and-Play Hardware Appliance: For locations lacking IT servers, Obkio provides a Hardware Agent that’s easy to deploy, ensuring branch offices are not left out of the monitoring ecosystem.
Pros:
- Obkio’s user-friendly design simplifies the network monitoring for IT teams
- Its plug-and-play hardware agent, making it easily deployable in locations without IT infrastructure.
Cons:
- Obkio involves limitations in customization for advanced users
- The reliance on cloud storage, which might raise concerns for businesses with strict data sovereignty requirements.
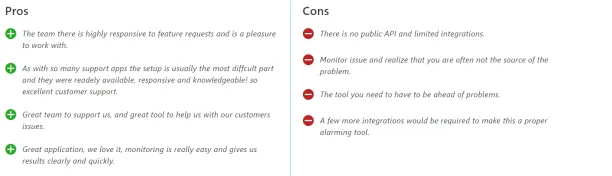
Figure 3: Customer reviews on Obkio
Source: Capterra3
3. ManageEngine Site24x7
ManageEngine Site24x7 provides insights into uptime and operational efficiency from a global perspective, leveraging over 130 monitoring locations worldwide and private network options.
Key Aspects:
- Public and Private Cloud Monitoring: Ensures visibility across cloud resources, supporting platforms like AWS, Azure, GCP, and VMware for workload monitoring and app performance troubleshooting.
- Synthetic Web Transaction Monitoring: The tool records and simulates multi-step user interactions in real browsers to optimize web applications like login forms and shopping carts.
Pros:
- Advanced Analytical Tools and AIOps Integration: Utilizes cutting-edge analytical tools and integrates artificial intelligence for IT operations (AIOps), enhancing anomaly detection and facilitating swift incident resolution.
- Real User and Synthetic Monitoring Capabilities: Equips organizations with both real user monitoring (RUM) and synthetic transaction monitoring, enabling a thorough application performance from multiple perspectives.
Cons:
Challenges in Plugin Implementation: Using standard or custom plugins is challenging due to the complexity of measurement methods and the setup of thresholds and availability checks, often leading to false positives.4
Difficulty in Configuring Network Elements: Configuring Network element is not easy as configuring WEB and Servers. 5
4. Dynatrace
Dynatrace offers an AI-enhanced platform for network observability, providing insights from the underlying infrastructure to user experience aspects.
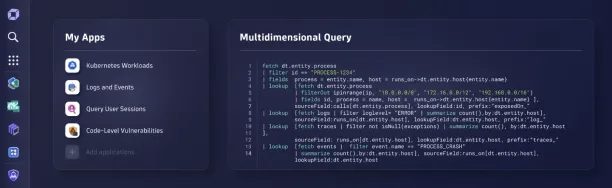
Figure 4: Dynatrace User Interface
Source: Dynatrace Website6
Key Aspects:
- PurePath Technology: Provides end-to-end transaction tracing for detailed visibility.
- Davis AI: Dynatrace’s AI engine, detects anomalies and provides root cause analysis.
Pros:
- Unified monitoring: Dynatrace’s OneAgent technology enables automatic data collection and full-stack instrumentation.
- Integration capabilities: With over 600 technology integrations, Dynatrace offers connectivity with a wide range of cloud platforms.
Cons:
- Learning Curve: The platform’s advanced features and capabilities require a significant time investment to learn and master, potentially slowing initial adoption.7
- Dependence on Proprietary Technology: Dynatrace’s OneAgent creates a dependency on proprietary technology, which could limit flexibility in integrating with custom or niche monitoring solutions.
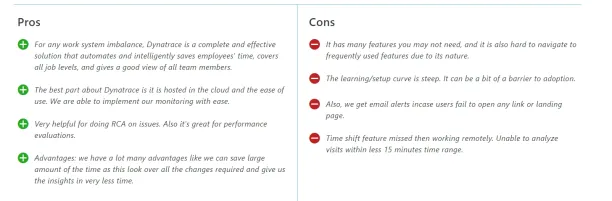
Figure 5: Customer reviews on Dynatrace
Source: Capterra8
5. Cisco ThousandEyes
Cisco ThousandEyes focuses on internet, cloud, and digital experiences to optimize user interactions across global networks.
Key Aspects:
- Internet and Cloud Intelligence: The tool provides insights into external dependencies that impact network performance.
- Path Visualization: Cisco ThousandEyes offers a view of network paths, identifying issues across internal and external networks.
Pros:
- Visibility: Cisco ThousandEyes offers application-aware monitoring and DNS, BGP, and VoIP/UCaaS monitoring, enabling thorough understanding and oversight of digital experiences.
- End User Experience Monitoring: Provides insights into user experience from employee devices, including network path visualization and performance metrics (Wi-Fi strength, VPN, DNS).
Cons:
- Learning Curve: Users report a significant learning curve to fully grasp and utilize the product’s extensive capabilities, which can delay maximizing its potential.9
- Dependency on External Agents: The reliance on Cloud and Enterprise Agents for data collection might introduce complexities in deployment and management.10
6. LogicMonitor
A cloud-based service that offers network observability, emphasizing automation and coverage of network devices and flows.
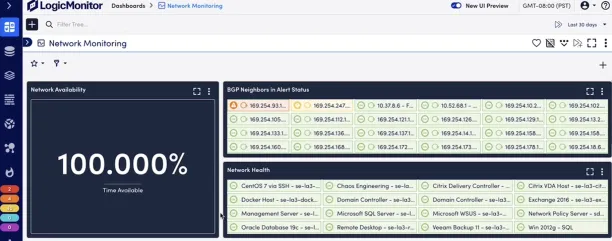
Figure 6: LogicMonitor User Interface
Source: LogicMonitor Website11
Key Aspects:
- Dynamic Topology Mapping: Offers real-time network visualization through dynamic topology maps, enhancing understanding of network structure and performance.
- Agentless Collector for Quick Deployment: Utilizes an agentless collector for rapid deployment, providing comprehensive network visibility without extensive setup.
Pros:
- Network visibility: LogicMonitor’s support for over 2000 integrations allows device and network type monitoring.
- Ease of setup and maintenance: The agentless collector facilitates deployment and management, providing quick setup and network insights with minimal operational overhead.
Cons:
- Complexity for Smaller Organizations: The functionalities and integrations presents a steep learning curve for smaller organizations.
- Cost Consideration: The cost of LogicMonitor, especially at scale with its advanced monitoring capabilities, is a significant consideration for budget-conscious businesses.

Figure 7: A LogicMonitor User Review
Source: G212
Read: Top 5 LogicMonitor Competitors
7. Datadog
Datadog enhances network observability by offering a cloud-based platform that aggregates real-time data from applications.
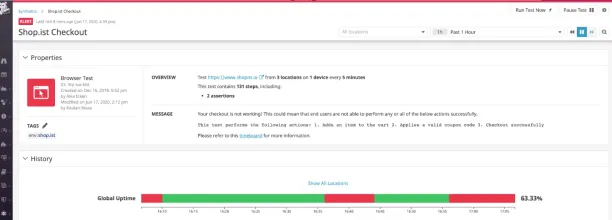
Figure 8: Datadog User Interface
Source: Datadog Website13
Key Aspects:
- Live network maps: Datadog offers a dynamic visualization of network traffic flow and dependencies.
- Service-level objective (SLO) tracking: This tool monitors and ensures the network performance aligns with business objectives.
Pros:
- Network Observability: Datadog enables end-to-end visibility into application performance, infrastructure health, and security posture by integrating distributed tracing with metrics, logs, and telemetry.
- Advanced Problem Detection: With features like automatic anomaly detection, code profiling, and real-time service monitoring, Datadog identifies operations and infrastructure issues, facilitating timely optimizations and preventing potential disruptions.
Cons:
- Complexity for Smaller Teams: The features of Datadog can be overwhelming for smaller teams or organizations without dedicated DevOps or security personnel, potentially steepening the learning curve.
- Cost at Scale: The price of the tool can increase significantly with the ingestion and processing of extensive logs and telemetry data, potentially affecting projects with tight budgets.
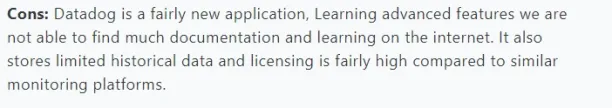
Figure 9: Customer reviews on Datadog
Source: Capterra14
8. Zabbix
Zabbix provides a network observability solution, designed to accommodate the expansive monitoring needs from smart home applications to large, multi-tenant enterprise environments.
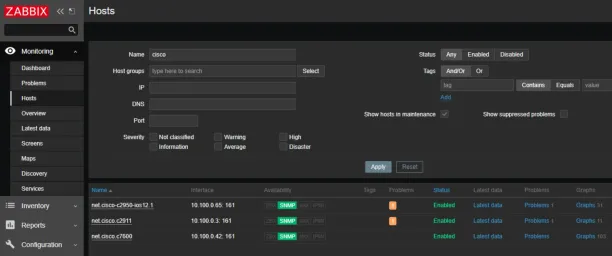
Figure 10: Zabbix Advanced Visualization, dark theme
Source: Zabbix Website15
Key Aspects:
- Integration capabilities: The tool offers ready-to-use templates for easy integration with existing alerting, ticketing, IoT, and ITSM systems.
- Global partner and vendor aupport: Zabbix is uniquely supported by over 250 global partners and various external vendor.
Pros:
- Monitoring capabilities: Zabbix excels in its ability to monitor various metrics, offering numerous data collection, transformation, and visualization options to suit different monitoring needs.
- Availability and security: It provides high availability solution to ensure continuous uptime and incorporates features like external vault storage for sensitive information, emphasizing data security and infrastructure reliability.
Cons:
- Complex Configuration: Zabbix has a complex setup and configuration process, requiring a steep learning curve for new users.
- Resource intensity for large deployments: In very large or complex environments, Zabbix can become resource-intensive, necessitating careful planning and potentially significant hardware investment to maintain performance.
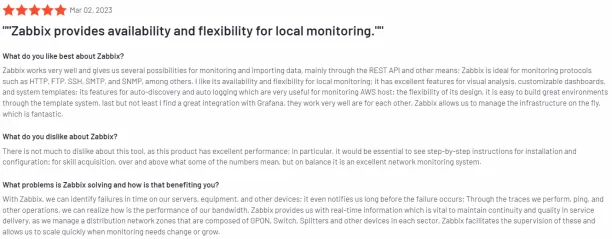
Figure 11: Zabbix User Reviews
Source: G216
Free network monitoring tools are an option for SMEs looking to improve their network efficiency and security without high expenses. If you are associated with a small or medium-sized business, check out the top free network monitoring tools.
FAQ
What distinguishes network observability from network monitoring?
Network monitoring and network observability, while related, serve distinct functions in managing network health. Network monitoring is focused on tracking specific metrics and thresholds to maintain network performance. In contrast, network observability offers a more expansive and in-depth perspective, incorporating network monitoring’s capabilities while adding context, real-time visibility, and adaptability for complex and evolving networks.
Think of network observability as an advanced stage of network monitoring. It enhances monitoring’s foundational aspects by incorporating more diverse data sources, sophisticated analytics, and smart automation. This evolution enables deeper insights into network infrastructure, facilitating informed decision-making for superior network performance, security, and reliability.
What are top key must-have features of Network Observability tools?
Improved Problem-Solving and Root Cause Identification: Provides detailed insights into network operations, facilitating quicker and more accurate troubleshooting and issue resolution.
Network Performance and Resource Optimization: Allows for the analysis of network usage and performance data to identify optimization opportunities, improving efficiency and user experience.
Effective Network Capacity Management and Growth Planning: Supports strategic planning for network capacity and scalability by analyzing usage trends and forecasting future demands.
Comprehensive Network Behavior Insights: Offers a holistic view of the network, aiding in the understanding of complex interactions and the optimization of network performance.
Data-Informed Strategic Decisions: Empowers organizations to make informed decisions regarding network management and optimization based on actionable data insights.
Can small businesses benefit from network observability tools?
While the scale and complexity may vary, small businesses also face network performance and security challenges that can be effectively managed with the right observability tools.
How do AI and machine learning enhance network observability tools?
AI and machine learning algorithms analyze vast amounts of data to identify patterns, anomalies, and predict potential issues, enabling more proactive and efficient network management.
What is Telemetry?
Telemetry is the automated process of collecting data from remote or inaccessible devices and systems, crucial for network monitoring. It enables the real-time tracking of network performance, health, and operational metrics, facilitating proactive issue detection and resolution, thereby enhancing network reliability and efficiency.
How to select the best observability tools?
Choosing the network observability tools depends on several factors, including the size and complexity of your network, specific monitoring and analytics needs, budget constraints, and integration requirements with existing systems. Here are some considerations:
Scalability: Ensure the tool can scale with your network’s growth.
Integration: Look for solutions that seamlessly integrate with your existing IT ecosystem.
Customization: Customizable dashboards and alerts can greatly enhance usability and relevance.
Support and Community: Consider the level of support offered by the vendor and the presence of an active user community for sharing best practices.
For more on network monitoring
- Top 7 Free Network Monitoring Tools based on 1,000+ Reviews in 2024
- Top 10 Network Monitoring Software based on 3,000+ Reviews
- In-Depth Look at AKIPS Network Monitoring Software in 2024
- Top 5 Network Performance Monitoring Tools in 2024
External Resources
- 1. “A Review of AKIPS”. Capterra September 24, 2020. Retrieved March 25, 2024
- 2. “ Obkio“. Retrieved March 25, 2024
- 3. “User Reviews of Obkio”. Capterra Retrieved March 25, 2024
- 4. “A Review of Zabbix by
Alex P.“. G2 March 02, 2023. Retrieved March 25, 2024 - 5. “A Review of ManageEngine Site24x7 by
Selvakumar S.“. Capterra December 5, 2018. Retrieved March 25, 2024 - 6. “ Dynatrace“. Retrieved March 25, 2024
- 7. “A Review of Dynatrace by Khatibur R.”. Capterra August 30, 2023. Retrieved March 25, 2024
- 8. “User Reviews of Dynatrace”. Retrieved March 25, 2024
- 9. “A Review of Cisco ThousandEyes”. G2 January 19, 2024. Retrieved March 25, 2024
- 10. “A Review of Cisco ThousandEyes by Mario Alfonso R.”. G2 March 02, 2023. Retrieved March 25, 2024
- 11. “ LogicMonitor“. Retrieved March 25, 2024
- 12. “ A user Review of LogicMonitor“. G2 Mar 11, 2024, Retrieved March 25, 2024
- 13. “ Datadog “. Retrieved March 25, 2024
- 14. “A Review of Datadog by Khatibur R.”. Capterra August 30, 2023. Retrieved March 25, 2024
- 15. “Zabbix “. Retrieved March 25, 2024
- 16. “A Review of Zabbix by
Alex P.“. G2 March 02, 2023. Retrieved March 25, 2024

Cem is the principal analyst at AIMultiple since 2017. AIMultiple informs hundreds of thousands of businesses (as per Similarweb) including 60% of Fortune 500 every month.
Cem's work has been cited by leading global publications including Business Insider, Forbes, Washington Post, global firms like Deloitte, HPE, NGOs like World Economic Forum and supranational organizations like European Commission. You can see more reputable companies and media that referenced AIMultiple.
Throughout his career, Cem served as a tech consultant, tech buyer and tech entrepreneur. He advised enterprises on their technology decisions at McKinsey & Company and Altman Solon for more than a decade. He also published a McKinsey report on digitalization.
He led technology strategy and procurement of a telco while reporting to the CEO. He has also led commercial growth of deep tech company Hypatos that reached a 7 digit annual recurring revenue and a 9 digit valuation from 0 within 2 years. Cem's work in Hypatos was covered by leading technology publications like TechCrunch and Business Insider.
Cem regularly speaks at international technology conferences. He graduated from Bogazici University as a computer engineer and holds an MBA from Columbia Business School.
Sources:
AIMultiple.com Traffic Analytics, Ranking & Audience, Similarweb.
Why Microsoft, IBM, and Google Are Ramping up Efforts on AI Ethics, Business Insider.
Microsoft invests $1 billion in OpenAI to pursue artificial intelligence that’s smarter than we are, Washington Post.
Data management barriers to AI success, Deloitte.
Empowering AI Leadership: AI C-Suite Toolkit, World Economic Forum.
Science, Research and Innovation Performance of the EU, European Commission.
Public-sector digitization: The trillion-dollar challenge, McKinsey & Company.
Hypatos gets $11.8M for a deep learning approach to document processing, TechCrunch.
We got an exclusive look at the pitch deck AI startup Hypatos used to raise $11 million, Business Insider.
To stay up-to-date on B2B tech & accelerate your enterprise:
Follow onNext to Read
Top 5 Network Performance Monitoring Tools in 2024
Top 12 Data Observability Tools in 2024
Related research
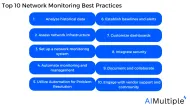
Top 10 Network Monitoring Best Practices in 2024

Comments
Your email address will not be published. All fields are required.